
Forecast Future Trends Using Facebook’s Prophet
Forecasting is hard — and yet a common task for any analyst is forecasting the future based on historical data. To properly understand how to forecast requires knowledge of complicated mathematical concepts but Prophet by Facebook makes this task so much easier.
Prophet is an open-source forecasting tool using a time series additive model and is available both in Python and R. The key advantage of using Prophet is its simplicity to generate a sophisticated forecast without a deep understanding of forecasting or time series analysis required.
“Stan performs the MAP optimization for parameters extremely quickly (<1 second), gives us the option to estimate parameter uncertainty using the Hamiltonian Monte Carlo algorithm, and allows us to re-use the fitting procedure across multiple interface languages.” Instead of using traditional and complicated models such as ARIMA, the Prophet library simplifies the ability to build forecasting models for time series data.
In this post, I’ll take you through how I was able to forecast Paid Search revenue based on historical data using Prophet in R.
First, install the package;
install.packages('prophet')
Now it’s time to load the library
1
2
library(prophet)
library(dplyr)
Up next is to add the historical data into the R environment by loading it into a data frame. Ensure that the data has two fields, one called ds which represents the date and y, a numeric value (whatever metric is being forecast).
df <- read.csv('path') %>%
Mutate is a dplyr function which computes and adds new variables, in this case transforming the y values to log.
mutate(y = log(y))
In my specific example I wanted to forecast revenue, so I want the y values to be exponential rather than logarithmic so I use;
df$y <- exp(df$y)
Now we call the prophet function to fit the model.
m <- prophet(df)
The make_future_dataframe function takes the model and specified number of periods to forecast and produce a dataframe.
1
2
future <- make_future_dataframe(m, periods = 245)
tail(future)
Use the predict function to get the forecast which sits within the dataframe in the column yhat.
1
2
forecast <- predict(m, future)
tail(forecast[c('ds', 'yhat', 'yhat_lower', 'yhat_upper')])
Below we select the fields which we will be using to plot the data which is the point estimate as well as the upper and lower bounds.
select(ds, yhat, yhat_lower, yhat_upper)
To visualise the forecast in R, run the below;
1
2
3
4
5
6
7
8
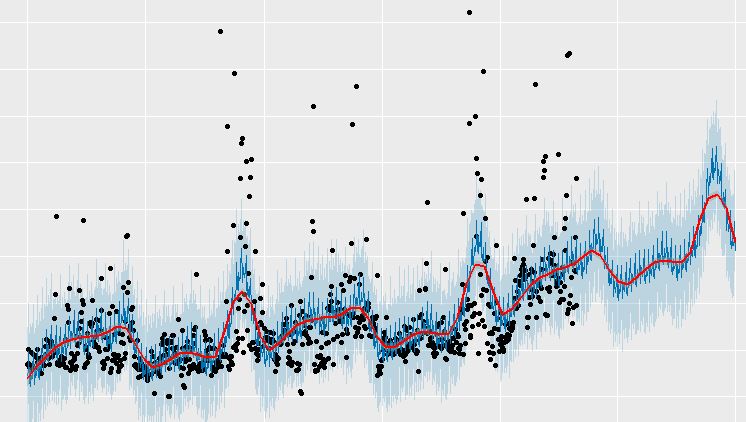
plot(m, forecast) +
labs(title = "x",
subtitle = "x",
y = "x",
x = "x",
caption = "Red line indicates trend for historical data / point estimate for forecasts") +
scale_y_continuous(labels = scales::comma) +
geom_smooth(aes(x = ds, y = yhat), colour = "red", method = "loess", span = .1)
That’s it, now you can visualise your forecast in R!
This kind of analysis is extremely powerful and can be run on any data set in a matter of minutes. The above is what I’ve used to generate a forecast but following the relevant guides, additional emphasis on holidays and other seasonal events can be accounted for. Prophet is a great tool for any digital analyst when it comes to forecasting any relevant business metric.